
Which KPI to choose for its e-commerce?
Like any e-merchant, you have certain goals.
Increasing sales, revenues generated by your e-commerce or brand awareness… whatever your main goals are, you will need measurable values, known as key performance indicators or KPIs, to help you reach them.
What is a KPI
KPIs (Key Performance Indicators) are measurement tools that help determine the margin for improvement of an action or a system.
In e-commerce, KPIs are measurable and quantifiable factors that allow you to evaluate the performance of a site and/or a digital strategy. In other words, KPIs allow you to know if you are on the right track, because they help you understand what is working and what is not.
Monitoring and measuring your KPIs on a regular basis also allows you to make decisions based on real data and to define the changes to be made to improve your performance.
Define the right KPIs for your e-commerce
Choosing the right KPIs for your business can be a tricky business. There are indeed many indicators for e-commerce, but the good KPIs are not all the same for all e-merchants.
Assume that the choice of your KPIs will depend above all on the objectives that you have previously defined. It is therefore only by setting specific objectives that you can define the right KPIs for your e-commerce.
For example, if one of your objectives is to improve your sales by 15% in the next 6 months, you can choose the following KPIs:
- number of leads;
- conversion rate;
- daily / weekly / monthly sales;
- cart abandonment rate.
However, if you are looking to increase your email open rates, your KPIs will be completely different:
- thard bounce (the e-mail cannot -and will never- be delivered to its recipient because of an unsolvable problem: invalid or erroneous address for example);
- soft bounce rate (the e-mail did not land in the recipient’s inbox for a reason that can be solved: temporary problem with the receiving server or full inbox for example);
- total open rate;
- click rate;
- unsubscribe rate;
- deletion rates.
Therefore, the relevance of each KPI depends strictly on each objective. Tracking shopping cart abandonment rates might help you identify sales-related issues, but will not make sense when it comes to e-mail marketing.
So which KPIs should you choose?
Remember that your KPIs will help you achieve your goals by testing, refining and expanding what works, and eliminating what doesn’t.
With this in mind, you can check out this list of the most important metrics for e-commerce. All of these KPIs can be monitored via a tool such as Google Analytics to help you measure the success of your digital actions and your site.
All you have to do is choose the ones that interest you according to your e-commerce structure, your objectives and your target customer.
Top 9 e-commerce KPIs
KPI #1 – Customer acquisition cost
As the name suggests, the customer acquisition cost (CAC) is a metric used in e-commerce to determine the amount spent to acquire a new customer.
It is an important KPI that will help you determine your true ROI by allowing you to see which campaigns are boosting sales, and which are the most expensive.
Logically enough, if a campaign only brings you clicks, but no sales, it is not working. Thanks to the CAC, you will be able to realize that acquiring less traffic with a high conversion rate can sometimes be more profitable than getting a huge amount of traffic that converts little.
To calculate the CAC, use the following formula:

To get actionable data, evaluate your different acquisition channels (organic, paid, social, referral, etc.) and your digital campaigns separately. To avoid skewing the results, don’t forget to select the “New Users” segment in Google Analytics.
How to optimize your customer acquisition cost?
- Optimize your campaign settings.
- Put all unprofitable campaigns on hold.
- Add to your marketing budget by investing more in channels that bring you quality traffic at a lower cost.
KPI #2 – Conversion rate
The conversion rate is probably the most important e-commerce KPI of all. It shows what percentage of visitors to your site have been converted into potential leads.
The conversion rate is frequently used to measure the effectiveness of a landing page, as it shows which page contains the best content and offers the most optimal user experience.
You can consider many actions as conversions, depending on your goals (add to cart, completed signup form, number of page views, etc.) and track their conversion rate separately.
Most analytics tools like Google Analytics automatically calculate the conversion rate. If you still want to do it manually, use the following formula:

For example, if your e-commerce is visited 5000 times and 200 of these visits result in a sale, you have a conversion rate of 4%.
Note that the average conversion rate in e-commerce is between 2 and 5%.
A high conversion rate indicates that you are able to convince a large number of visitors to buy your products or services, while a lower rate means that few buyers are willing to spend their money on your site, or that your traffic may not be targeted enough.
Finally, keep in mind that the overall conversion rate is one thing, but different segments will have varying rates. For an accurate analysis, break down conversions by traffic sources, marketing campaigns, locations and search keywords.
How to optimize your conversion rate?
- Leverage your site’s usability and design, pricing, product description, and social proof from customer reviews.
- Analyze the buying experience you provide by testing your sales funnel to ensure that all steps in the checkout process are running smoothly.
- Analyze your site’s visitor behavior, page views and exit pages to identify where the problem is coming from.
- Identify ways to make conversion easier (faster delivery option, diversification of payment methods, etc.).
KPI #3 – Shopping cart abandonment rate
The basket abandonment rate is another must-have e-commerce KPI. It shows the percentage of visits in which a user added at least one item to the cart, but left the site without completing the purchase.
Cart abandonment rate results from the difference between the shopping experience in a physical store and that on an e-shop, which generates a wide range of factors that can distract users or slow down the online purchase.
See also how to reduce the various obstacles to online purchasing
Tracking this KPI allows you to understand what’s going on, identify the problems users are having with your checkout process, and make the necessary changes.
For example, if you see that the majority of users are abandoning their shopping carts when they see your shipping rates, you may want to consider reducing them or offering free shipping above a certain purchase amount. Another example: if it seems that customers are put off by the requirement to create an account, you can consider giving them the option to order as a guest.
To calculate the cart abandonment rate, use the following formula:
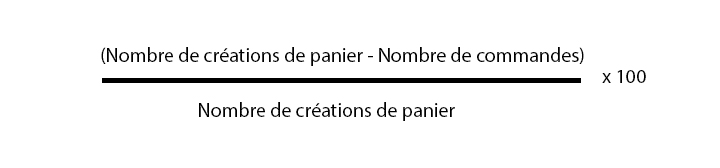
As an example, if you have 100 orders completed and 500 cart creations, then your cart abandonment rate is 80%.
In order to know the number of transactions initiated in Google Analytics, you will need to use a specific event tracker that allows you to follow the number of times users have added an item to the cart, and when they leave the checkout process. You can then compare this to the number of orders placed on your site.
How to optimize your cart abandonment rate.
- Be transparent about shipping costs.
- Do not require the user to create an account to place an order.
- Make your purchase tunnel as simple and clear as possible.
- Make your order form as short as possible.
- Add security certifications.
- Offer as many payment options as possible.
- Launch a remarketing campaign targeting users who abandoned their shopping carts.
See also our best practices for abandoned cart recovery
KPI #4 – Average value per order
The average value per order (also known as average basket) is a strategic KPI that measures the average amount spent on each order placed on an e-commerce site.
It’s a critical e-commerce metric to monitor that will help you make pricing decisions, understand customer buying habits and determine which acquisition channels to focus your marketing efforts on, among other things.
To calculate the average value per order, use the following formula:

Note that, as the name implies, the average value per order is tracked per order, not per customer. In other words, each order placed by a customer on your e-commerce (no matter how many times he buys on a given day) is taken into account as a separate entity in the average basket calculation.
As an example, let’s say you have 1000 orders for a total amount of 25 000€. Divide 25,000 by 1,000: you have an average value per order of 25€.
In Google Analytics, you can easily access the average value per order in the section Conversions > E-commerce > Overview. To refine your analysis and better filter the data by traffic sources and locations, use the default or custom segments.
However, you should also know that Google Analytics does not always track all transactions made on your e-commerce site. To have a complete view of your sales, you should use a tool like RJMetrics.
How to maximize your average value per order?
- Offer free shipping on purchases over a certain amount.
- Set up bundled offers.
- Implement loyalty programs.
- Implement related products.
- Consider selling add-ons or additional services.
KPI #5 – Site traffic
The increase in traffic is a goal shared by many e-tailers.
In addition to leading to purchases, traffic improves awareness of your business. Logically, the more visitors there are to your e-commerce, the more likely they will remember your brand, tell friends and family about it, or return when they feel like buying a product or service you sell.
This is why traffic is one of the most popular and important statistics to track for an e-commerce site.
In order to further analyze the traffic on your site, you can track these different metrics and acquisition sources in Google Analytics (or a similar tool):
- Page views per visit: it gives you an idea of how many pages a visitor or group of visitors view on your site. Higher page views per visit indicate that your content resonates with your target audience and that your site is easily navigable.
- Traffic sources: it lets you know which other website(s) and acquisition channels are sending you a lot of traffic. Knowing which sources are bringing you the most visitors allows you to identify which types of channels to focus on and spend more money on, but also points you to potential problems. If your referrals from other websites are low or non-existent, it may indicate that your marketing or link building campaigns are not working properly. Additionally, low traffic from ads may encourage you to reconsider the keywords you are targeting, or possibly the amount you are spending.
- Number of unique visitors vs. number of return visitors: unique visitors are those who visit your website for the first time on a new device, while return visitors are those who come back to your site from the same device. If your site attracts a lot of unique visitors, make sure you make it as user-friendly and easy to use as possible to speed up conversion.
KPI #6 – Bounce rate
The bounce rate is the percentage of visitors who viewed a single page of your website without interaction. This is a KPI to watch closely, as Google takes it into account when positioning your website on certain keywords.
To calculate the bounce rate, use the following formula:

A high bounce rate is perfectly normal, but beyond 80%, it gives you an indication of the relevance of your content, the usability of your website or the difficulty encountered by the user to find the information they were looking for.
How to optimize your bounce rate?
- Attract the right visitors with the right keywords (adjust your SEO strategy by focusing more on long tail keywords).
- Improve the usability of your landing pages.
- Corrigez la mise en page.
- Correct the layout.
- lace relevant CTAs and forms in your landing pages to encourage the user to interact and continue browsing.
See also how to create a good CTA
KPI #7 – Retention rate
Theretention rate (or loyalty rate) is the percentage of customers acquired over a period of time who came back to buy.
Retention has a significant impact on the average lifetime value of the customer, and therefore on their profitability.
To calculate the retention rate, use the following formula:

Your retention rate will depend primarily on your ability to build a lasting relationship with your customers.
How to optimize your retention rate?
- Sell a quality product or service 😉
- Respect delivery times.
- Optimize your shipping conditions.
- Offer a seamless shopping experience.
- Encourage return by offering incentives to your customers (loyalty program, promotional code after a first purchase, send personalized offers via email, etc.).
- Maintain and retain the relationship by regularly soliciting your customers with targeted messages.
- Implement remarketing campaigns.
KPI #8 – Return and refund rates
The return and refund rate is the percentage of products purchased that were returned to you.
A high return rate indicates problems with product quality or customer satisfaction. Even though returns are unavoidable, they are a problem because they are costly: each returned item not only reduces your revenue, but can also mean that one of your customers is dissatisfied or disappointed, which can damage your brand image and credibility.
To calculate your return rate, use the following formula:

Segmenting your return rate by products and categories will help you remove underperforming products from your catalog.
How to optimize your return rate?
- Make sure your customers see and understand what they are buying (HD photos of the product from different angles, in use and in perspective, description of materials used, exact measurements of models, etc.)
See also our advices on return and refund policy to adopt in e-commerce
KPI #9 – Customer Lifetime Value
The customer lifetime value measures the total amount of money a customer spends on an e-commerce during their relationship with it.
It’s an important KPI for evaluating whether your customers are bringing in more than you spent to acquire them.
In other words, if you spend 100€ to acquire a customer, you should make sure that this amount is returned by what the customer will spend in the next year.
To calculate the customer lifetime value, use the following formula:

As an example, let’s say you have 100 customers. Each of them spends an average of $55.50 and 30 of these customers come back an average of 3 times a year. You expect to keep these customers for 2 years. The customer lifetime value then amounts to €277.50.
How to optimize customer lifetime value?
- Personalize the customer relationship.
- Focus on your customer service (free updates and lifetime support, be available when customers need you, provide multi-channel support, analyze and improve your emails, facilitate customer service).
- Fidelize your customers by offering rewards (early access to sales, exclusive first look at new products, information on upcoming sales, free goodies for every order placed, set up a bonus point system, etc.).
- Incorporate up-sells into your offers.
- Create interesting and motivating content.
The 9 KPIs presented above are just a few of the most important indicators for e-commerce. Make sure you choose the ones that best reflect your site’s goals.


Leave a Reply
You must be logged in to post a comment.