
Web figures & trends 2023: SEO, e-commerce, marketing, social networks
Marketing, SEO and social media strategies, as well as the ways in which people interact with mobile devices, make online purchases, consume content or search for information are all issues to be aware of in order to better adapt to the new behaviors and uses of the Internet.
So here is a compilation of the most useful web statistics, facts and trends for 2022-2023.
Internet & mobile figures and trends
Figures and trends websites & blogs
E-commerce figures and trends
Marketing figures and trends
SEO & Google figures and trends
Social networking figures and trends
Internet & mobile trends and figures 2023
As of July 1, 2021, there are more than 4.8 billion Internet users in the world, representing 61% of the world’s population.
- Asia has the largest number of Internet users at 50.3%. Next are Europe (15.9%), Africa (11.5%) and Latin America / Caribbean (10.1%). North America accounts for only 7.6% of all Internet users worldwide.
- China has the most active Internet users, with more than 854 million, followed by the United States (312 million) and Russia (nearly 110 million).
- North America has the highest Internet penetration rate (94.6%). This is followed by Europe (87.2%), Latin America/Caribbean (70.5%) and the Middle East (69.2%).
There are more mobile Internet users than desktop Internet users.
- Last year, global Internet traffic via computers accounted for less than 43%, compared to 55.35% for mobile devices (+11% compared to 2020).
- By 2022, mobile is expected to account for 59% of global Internet traffic.
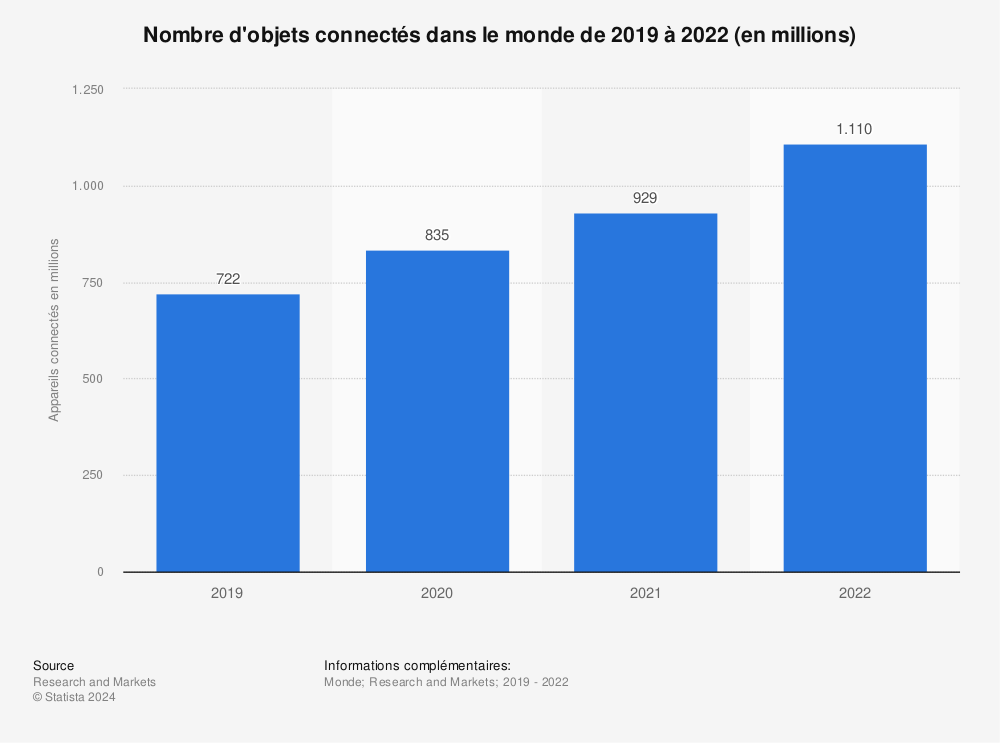
By 2021, there will be 11.7 billion connected devices worldwide.
- By 2023, a person in France will have an average of 3.6 connected devices and will spend more than 18 hours a week on the Internet.
By 2022, Internet video will account for 82% of global Internet traffic.
- 78% of Internet users watch online videos every week and 55% watch them daily.
- More than half of all video content is currently viewed on mobile.
Trends and figures websites & blogs 2023
There are over 1.60 billion websites in the world.
- The very first website was published on August 6, 1991 by British computer scientist Tim Berners-Lee.
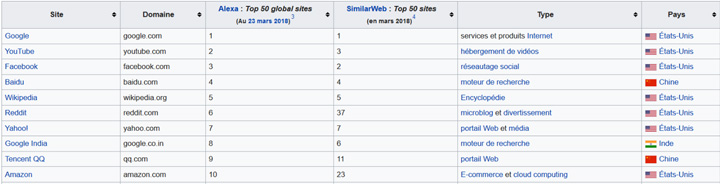
- Google would be the most visited website in the world, followed by YouTube and Facebook. The Chinese search engine Baidu ranks fourth.
There are currently more than 333 million domain names registered.
- This number has been increasing steadily by about 6.7% each year.
- The five most popular domain name extensions are currently: .com (133.9 million), .cn (21.4 million), .tk (19.9 million), .de (16.3 million) and .net (14.4 million).
- The most expensive domain name ever sold is LasVegas.com, which was purchased in 2005 for $90 million.
More than 2 million blogs are published on the Internet every day.
- Blogging continues to grow, with over 409 million people viewing over 23.6 billion pages each month on WordPress alone.
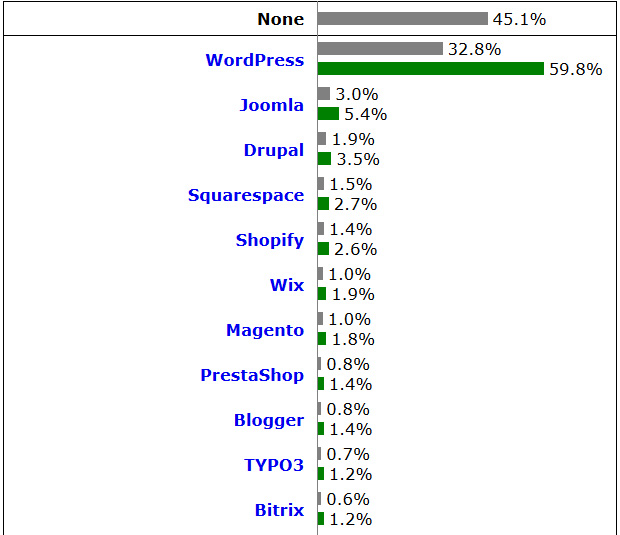
- With a market share of nearly 60% and about 20.6 million active websites, WordPress is the leading CMS in the world. It hosts sites like the New York Times, Forbes and even the Facebook Blog.
- 91.8 million blog posts are published each month.
Last year, 59.9% of the time spent on websites occurred on a computer.
- Although the majority of global Internet traffic is mobile, the time spent on websites via a computer is still higher than the time spent on them with a mobile device. This is partly due to the fact that 89% of the time spent on mobile is spent using applications, with the remaining 11% spent on websites.
A user spends on average 88% more time on a website with video.
- The average CVR for websites using video is 4.8%, compared to 2.9% for those not using video.
E-commerce trends and figures 2023
China dwarfs all other markets in the e-commerce industry. This is expected to generate $4.891 trillion (around €5 trillion) by 2021.
Selon Business.com, les 10 plus grands marchés d’e-commerce dans le monde en 2020 étaient les suivants :
- China: $1,267 billion
- United States: $843 billion
- United Kingdom: $275 billion
- Japan: $237 billion
- Germany: $212 billion
- France: $126 billion
- South Korea: $114 billion
- Canada: $90 billion
- Russia: $60 billion
- Brazil: $57 billion
En 2021, tous devraient poursuivre leur croissance, l’Inde et la Chine étant les marchés à la croissance la plus rapide avec respectivement 22% et 21%. La seule exception dans cette liste est le Royaume-Uni, dont les ventes e-commerce devraient baisser de 6,3%.
Le chiffre d’affaires du e-commerce est comptabilisé à 112 milliards d’euros en France en 2020 selon la FEVAD.
More than half of the world’s Internet-using population will be shopping online by 2020.
-
In 2021, 69.4% of mobile users will be doing so.
-
85.5% of French Internet users buy on the Internet. They make an average of 33 online purchases per year.
In 2021, mobile commerce will represent 45% of all e-commerce activities.
- Last year, smartphones alone accounted for 57% of visits to e-commerce sites.
- Despite the increase in the use of mobile devices, online sales on the desktop continue to reign supreme. While the majority of smartphone and tablet owners (68%) have attempted to make a purchase on their device, two-thirds (66%) have not completed a transaction due to obstacles encountered during checkout.
Globally, 55% of online sales take place directly on the brands’ e-commerce sites.
- The remaining 45% are on marketplaces.
- 18 platforms share 75% of the purchases made on a marketplace in the world. In the top 5 we find Alibaba, with its two platforms Taobao and Tmall, Amazon, eBay and JD.com.
- Of the purchases made online in the United States, 50% take place on Amazon.
Cart abandonment accounts for $18 billion in lost sales each year.
- The shopping cart abandonment rate on mobile is higher (97%) than on computer (between 70 and 75%).
- The main reasons for shopping cart abandonment are: price, site loading time, shipping costs, speed of delivery and available discounts.
Only 35% of shoppers are willing to pay for delivery when ordering online.
- 8 out of 10 consumers will shop online if delivery is offered and they will spend 30% more per order if free delivery is included.
- 66% of shoppers decided not to buy an item they were considering because of the shipping costs.
In 2021, a page that takes 6 seconds to load will suffer a 50% conversion loss.
- 40% of Internet users abandon a website if it takes more than 3 seconds to load.
- 79% of shoppers who are dissatisfied with e-commerce performance say they are less likely to buy from the same site again.
Using videos on product pages can increase purchases by 144%.
- Videos up to 2 minutes in length get the most engagement.
Marketing, advertising & content trends and figures 2023
Digital advertising spending (fixed and mobile Internet) is expected to reach nearly $245 billion worldwide in 2020.
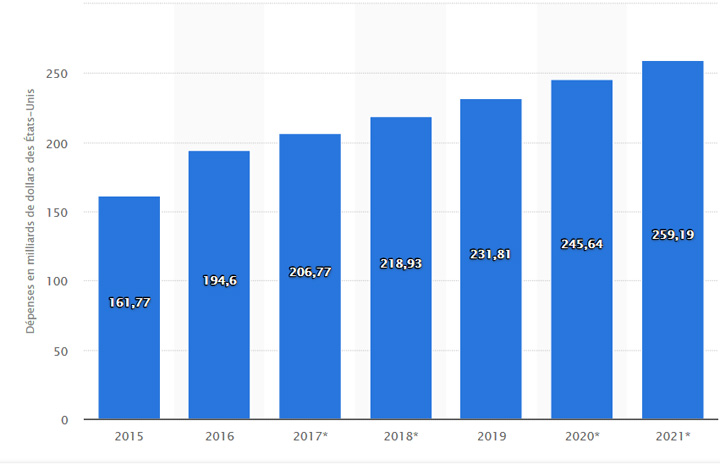
- In France, digital advertising spending has surpassed television advertising spending.
- By 2021, mobile advertising is expected to account for 72% of all digital ad spending in the US… But at the same time, 70% of people say they don’t like mobile ads. In fact, mobile ad blocking has increased by 90% year over year.
89% of B2B marketers use content marketing strategies.
- The most popular content marketing strategies include: social networks (83%), blogs (80%) and newsletters (77%).
By 2021, more than 80% of companies are expected to have some way to automate customer interactions.
- 38% of companies currently deploy a chatbot.
- Chatbots have a CTR 3 to 12 times higher than email marketing.
79% of people use their smartphone to read their e-mails.
- The probability of an e-mail being opened is 25% higher if it has a personalized subject line.
- 70% of people who check their email on a smartphone immediately delete emails that do not look good on a mobile device.
- An e-mail with a video receives a 96% higher click-through rate.
87% of online marketers use video content.
- Worldwide, 51% of marketers cite video as the type of content with the highest ROI.
- Marketers who use video have 49% more revenue than those who do not.
More than 90% of marketers who use an influencer marketing strategy think it is effective.
- According to industry professionals, the top three benefits of affluent marketing are: creating original content (87%), boosting engagement (77%) and increasing traffic (56%).
- On average, the implementation of an influencer marketing program increases brand mentions by nearly 15% and increases the positive view of the brand by nearly 9%.
SEO & Google 2023 trends and figures
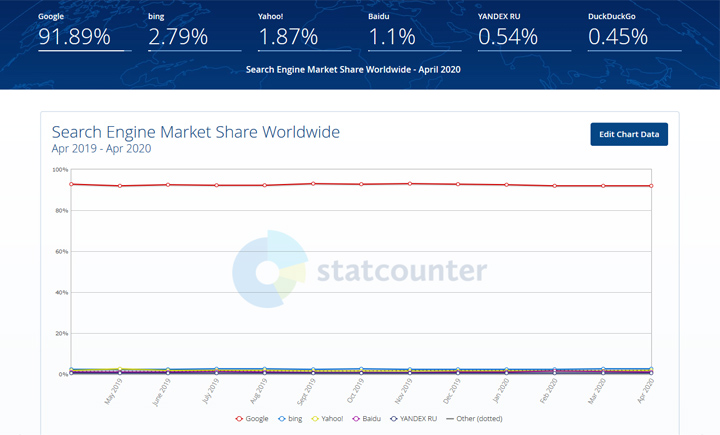
As of July 2021, 92.47% of all internet searches worldwide are conducted on Google.
-
- Bing (2.31%), Yahoo (1.53%), Baidu (1.29%) and Yandex (1.15%) are the other most used search engines worldwide.
6 billion Google searches are performed every day by 1.17 billion unique users.
- On average, 71,000 requests are made every second.
- 60% of Google searches come from mobile devices.
- Every day, 16 to 20% of the requests made have never been made before.
- 50% of queries contain four or more words, and the average first page result contains 1,890 words.
75% of Internet users never scroll to the first page in search results.
- Being in first position in Google will result in a 34.36% click-through rate for computers and a 31.35% click-through rate for mobile devices.
Quality content and links are the two most important signals used by Google to rank a website in search results.
- According to Andrey Lipattsev, Search Quality Senior Strategist at Google, who confirmed this in a Q&A session
Sites that appear on the 1st page of Google SERPs have an average load speed of less than 2,000 milliseconds.
- The fastest site to date would be bhphotovideo.com, followed by hm.com and bestbuy.com, both of which have load speeds of less than 0.5 seconds.
A video on a landing page would increase the chances of appearing on the 1st page of search results by 53%.
30% of mobile searches are location-based, and therefore proximity-based.
- Google searches for “near me” and “around me (“have doubled in the past year.
- 88% of consumers who have conducted a local search have visited a store within 5 miles and most visit within 24 hours.
Trends and figures social networks & social media 2023
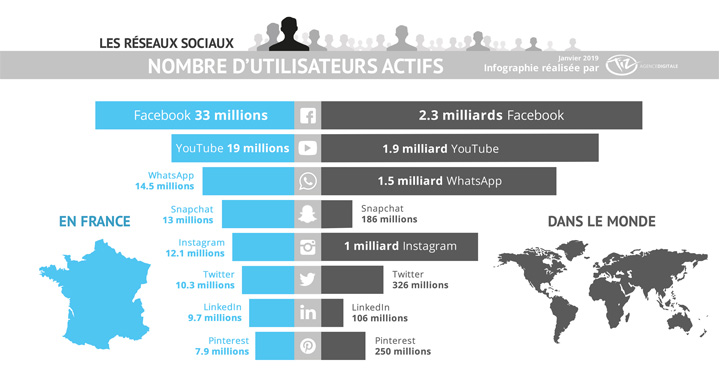
There are nearly 4.48 billion active social network users worldwide.
- Facebook, YouTube and Instagram are in the top 3 most used social networks (not including messaging apps Whatsapp, Wechat and Facebook Messenger).
- 99% of the time spent on social networks is spent on mobile.
- Internet users have an average of 7 accounts and spend 2 hours and 24 minutes per day on social networks.
91% of brands use two or more social channels.
- Facebook accounts for 53.1% of the social connections made by consumers to connect to applications and websites of publishers and brands.
- More than 2 billion messages are exchanged between brands and users every month on social networks.
- 45.8% of consumers say they prefer to contact a company by courier rather than by e-mail.
- 71% of consumers who have had a good service experience on social networks with a brand are likely to recommend it to others.
- The biggest brands on Instagram have a per-subscriber engagement rate of 4.21%, which is 58 times higher than on Facebook and 120 times higher than on Twitter.
Visual content is 40 times more likely to be shared on social networks than any other type of content.
- Social video generates 1200% more shares than text and images combined.
- Infographics are 3 times more likely to be liked and shared compared to any other type of content on social networks.
- Tweets with images receive 18% more clicks than tweets without images.
- Facebook status updates with images get 2.3 times more engagement than those without images.
Social networks influence the purchasing activities of 23% of consumers.
- More than 30% of online shoppers are willing to buy a product directly from a social network.
Facebook has 2.853 billion users, or about 23% of the world’s population.
- Almost 80% of Facebook users visit the site daily.
- Half of the Internet users who do not use Facebook themselves live with someone who does. Of these, 24% say they look at articles or photos on that person’s account.
- The most popular page is the main Facebook page with over 204 million likes. The most liked non-Facebook page is Cristiano Ronaldo’s with over 122 million likes.
Youtube has 2.291 billion monthly users, nearly a third of all Internet users.
- People watch 1 billion hours of YouTube videos every day.
- More than half of all views occur on a mobile device.
- The average mobile display session lasts over 40 minutes.
- In France, YouTubers Cyprien has the most subscribers (11.39 million).
- Globally, the video with the most views is the video for Luis Fonsi’s song “Despacito” with over 4.6 billion views.
Instagram has 1.386 billion monthly active users.
- 76% of Instagram users are under the age of 35, or about six out of ten online adults.
- 51% of Instagram users access the platform daily, and 35% say they look at the platform multiple times a day.
- 95 million photos and videos are shared every day on Instagram.
- Instagram is considered by 92% of marketing professionals as the most effective social network for setting up influencer campaigns. There are over 2 million active advertisers.
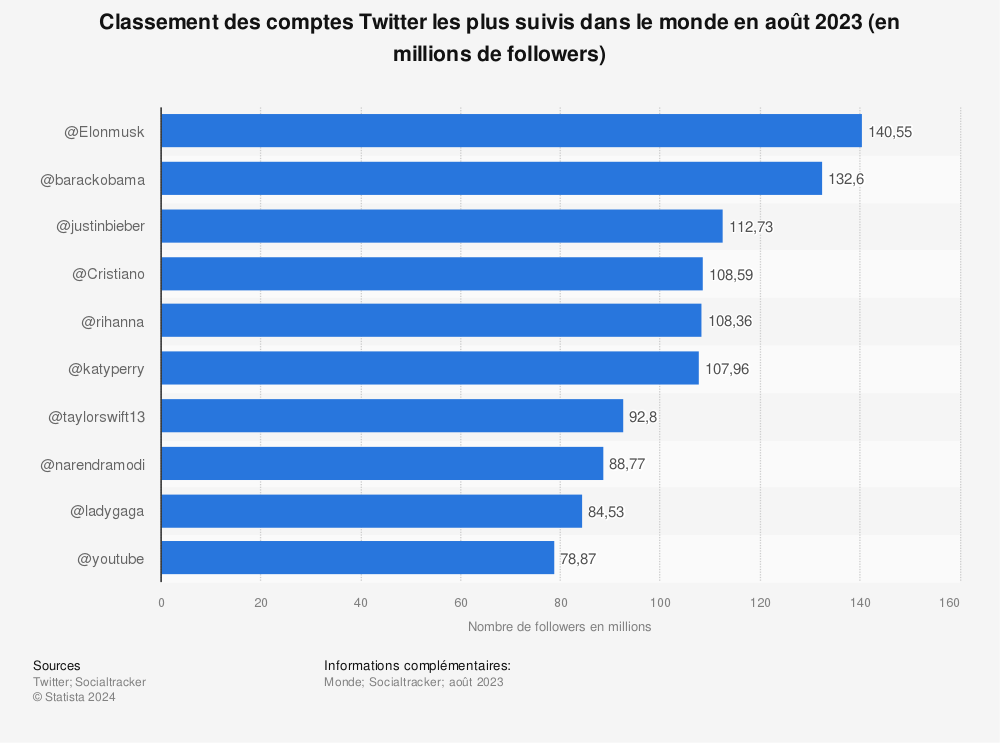
Twitter has 400 million monthly active users.
- 500 million people visit Twitter each month without logging in and 44% of users have never tweeted.
- 500 million tweets are posted every day, that’s 6000 tweets every second.
- Katy Perry’s account is the most followed on Twitter, with 106.8 million followers.
Find more statistics on Statista
Pinterest has over 478 million monthly active users.
- 67% are under 40 and the average time spent on the platform has tripled to over 75 minutes per visitor.
- Pinterest is the most mobile-friendly social network with 85% of traffic coming from smartphones or tablets.
- 93% of Pinterest users use the platform to plan or shop.
Snapchat has 514 million active users.
- 60% of them are under 25 years old and 38% use it regularly.
- 3 billion snaps are shared every day and nearly 9,000 photos every second.
Facebook Messenger and WhatsApp are the leading messaging services, with more than 50% of internet users using one or the other.
- Facebook Messenger and Whatsapp process 60 billion messages a day.
- 4 out of 10 mobile users use Facebook Messenger.
- Whatsapp and Facebook Messenger have 2 billion and 1.3 billion users respectively.
LinkedIn has 506 million members, of which approximately 116 million are active users.
Wechat has 1.242 billion users.
TikTok has 732 million users.
QQ has 606 million users.
Telegram has 550 million users.
Snapchat has 514 million users.
Reddit has 430 million users.
Skype has 300 million users.
Viber has 260 million users.
In summary:
By 2021, the use of mobile and IoT connected devices is expected to explode into an all-connected environment. Knowing that nearly 8 out of 10 Internet users would stop using content that does not display properly on their device, it is necessary to adapt to these media.
So if you want to stay competitive, you need to implement a mobile optimization or marketing strategy. Internet users use their smartphones more to read emails, check social networks and watch videos than to make calls!
Focus on visual content, especially video, but also on influencer marketing. Think about putting personalization in the spotlight by using a user-centric approach. In the case of an e-commerce, also solve the various obstacles to purchase: shipping costs, site loading time, responsive design … and look at new customer services, such as chatbots. Consumers are more likely to recommend and buy from a company that has a better mobile experience.
Providing value and an optimal experience to Internet users through quality content and an optimal experience on all devices is the best approach to succeed on the Internet and rank well in search engines.
See also:
- Key figures of the beauty sector
- Key figures for the luxury sector
- Key figures for the fashion sector
- Key figures for the tourism sector
- Key figures for the food sector
- Key figures for the health sector
- Key figures for the real estate sector
- Key figures for the watchmaking sector
- Key figures for the education and teaching sector
- Key figures for the lawyers’ sector
- Key figures for the culture sector
- Key figures for the automotive sector
- Key figures for the wine and spirits sector
- Key figures for the children and youth sector
- Key figures for the hotel sector
- Key figures for the jewellery sector
Sources:
Did you like this article?
Subscribe to our newsletter and you will receive our other articles once a month in your mailbox


Leave a Reply
You must be logged in to post a comment.